
Understand is very efficient at collecting metrics about the code it analyzes. These metrics can be extracted automatically via command line calls, exported to spreadsheets, viewed graphically, dynamically explored in the GUI, or customized via the Understand Perl API. They can also be reported at the project level, for files, classes, functions or user defined architectures.
Metrics Browser
To get started, just go to the top level menu in Understand and select Metrics -> Browse Metrics. Most of the metrics in Understand can be categorized in the following groups:
- Complexity Metrics (e.g. McCabe Cyclomatic)
- Volume Metrics (e.g Lines of Code)
- Object Oriented (e.g. Coupling Between Object Classes)
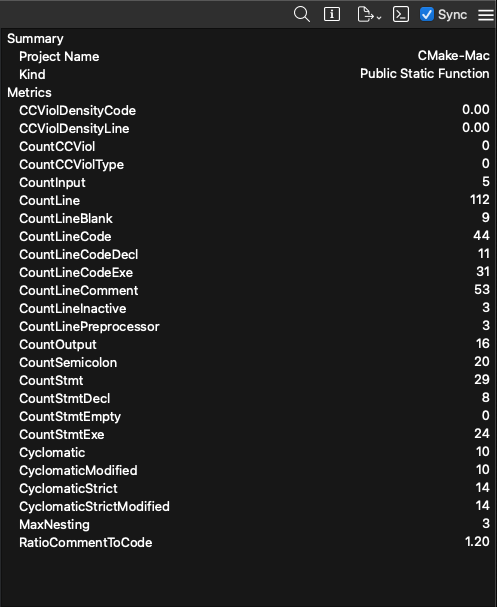
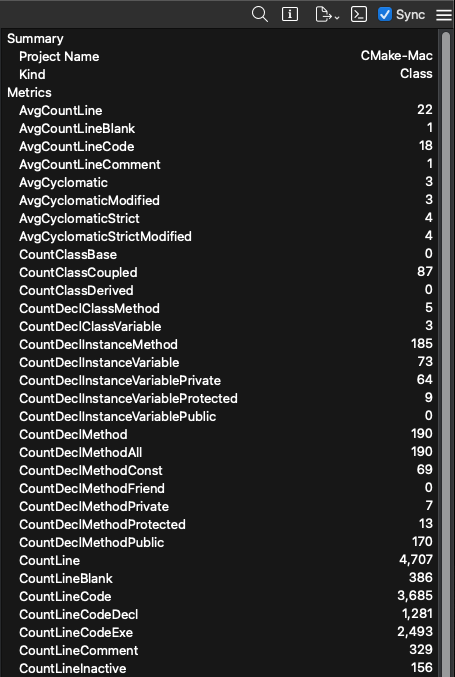
Note that not all metrics apply to all entities. Understand updates the Metric Browser dynamically depending on the entity selected. As an example, see the differences here between a static function and a class:
We don’t push a particular coding methodology and we consider ourselves “Metric Agnostic”. We won’t tell you that your code is “good” or “bad” we just try to report the data in the most flexible manner possible and let your team interpret it however you think best. Click here for a list of all available metrics, and click here for a detailed description describing how many of the metrics are implemented.
Graphical Views
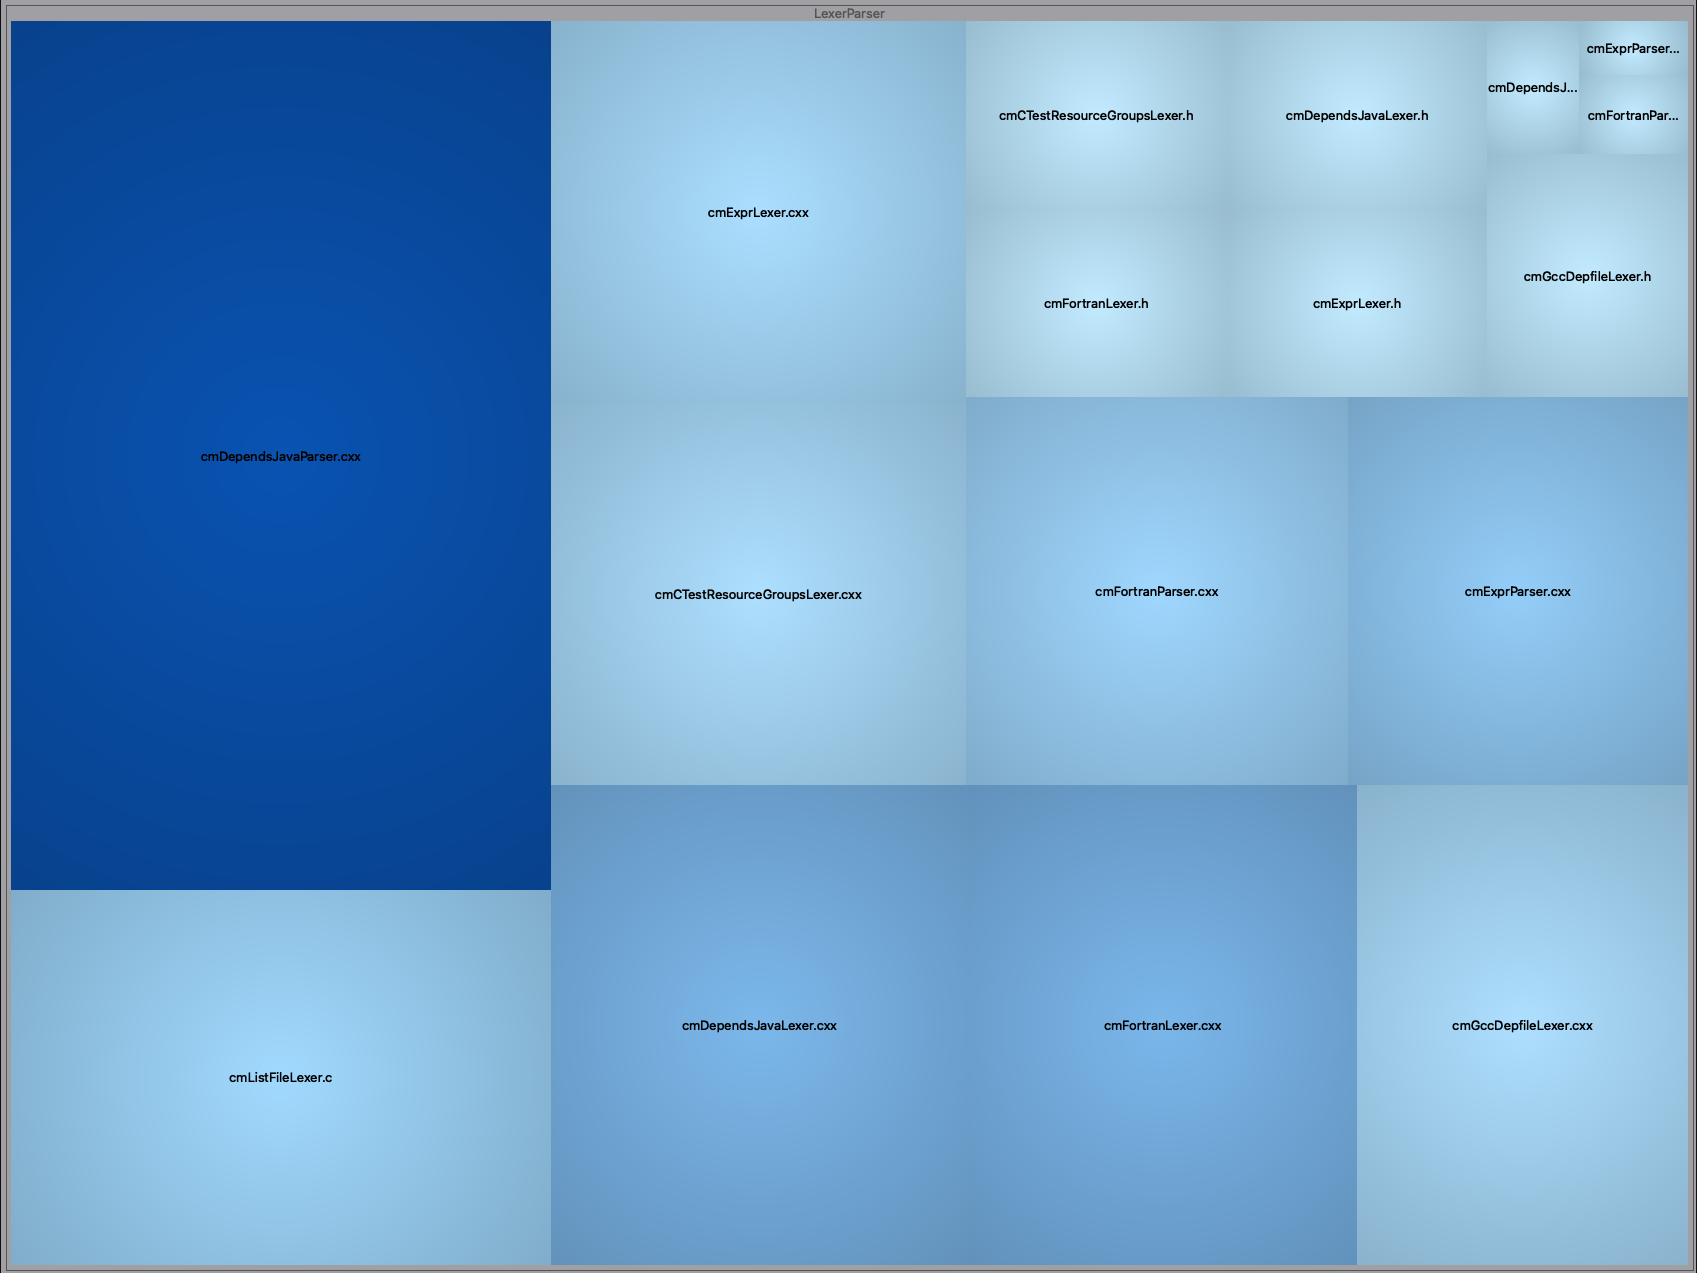
For those looking for a visual approach to their metrics, we offer Metric Treemaps that are fully customizable. Here I've mapped metrics for File entities, grouped them by the default Directory Structure, then mapped size of the node to the number of lines in the file and color-scale to the cyclomatic complexity:
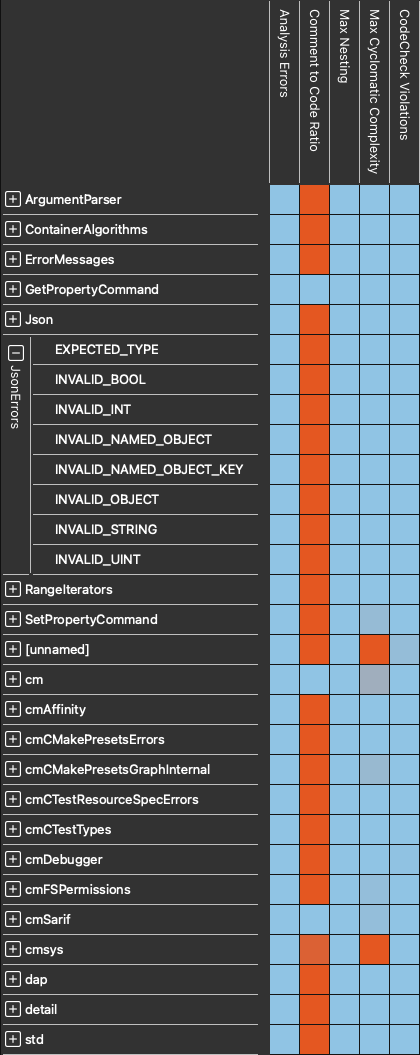
We also offer Metric Heatmaps that are configurable by Architecture:
Custom Metrics
Want to write your own? To help you develop custom metrics there are full Python and Perl API interfaces to the Understand database as well as a fully developed plugin mechanism. For example, there is a sample Perl API script that ships with Understand that generates the Halstead Maintainability Index for every file and function in your project.
If you've developed a metric and you'd like to share the development story with us, we'd love to hear from you! Just send us an email at support@scitools.com.